this one simple equation is responsible for rendering some very interesting visuals.
what is the equation really?
one way to think about the equation, is as a complex number generator. you pick an initial seed point and then feed it into the equation to get a new point:
( is the origin: )
and we can repeat it as many times as we want to generate a bunch of these complex numbers.
this set of complex numbers that we just calculated is called an orbit.
the mandelbrot set
perhaps the most popular fractal out there, is a set of all initial seed points for which the generated orbit does not blow up (diverge). when i say blow up, i mean its magnitude exceeds an escape radius . this escape radius is usually chosen to be , but can be anything larger as well.
formally,
if we think of each point on the complex plane as , and assign its intensity to be the length of the orbit before it escapes,
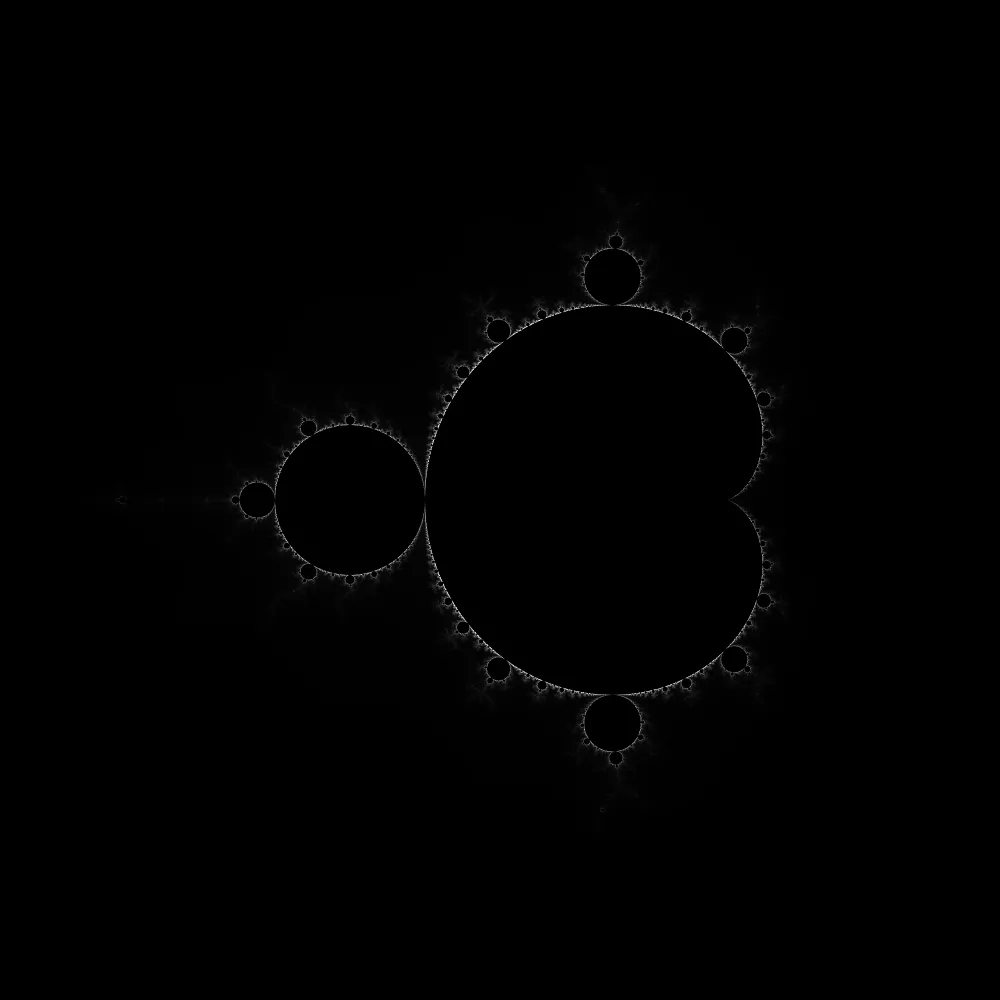
we get our classic, kinda weird looking fractal:

the points with orbits that remained bounded, have been colored black here (the ones inside the set).
the buddhabrot
kind of a weird name, but just go with it.
now, instead of coloring based on the length of the orbit, like we did for the mandelbrot set; here we take a different approach.
- we sample a lot of points randomly, i.e., random points and then generate their orbits.
- for all the orbits that did escape, we map each point in each orbit to a pixel coordinate, and increment its intensity.
so basically, the image is a histogram of all our random points from all our random orbits.
sounds like it should generate a bunch of random gibberish. but instead, we get this:
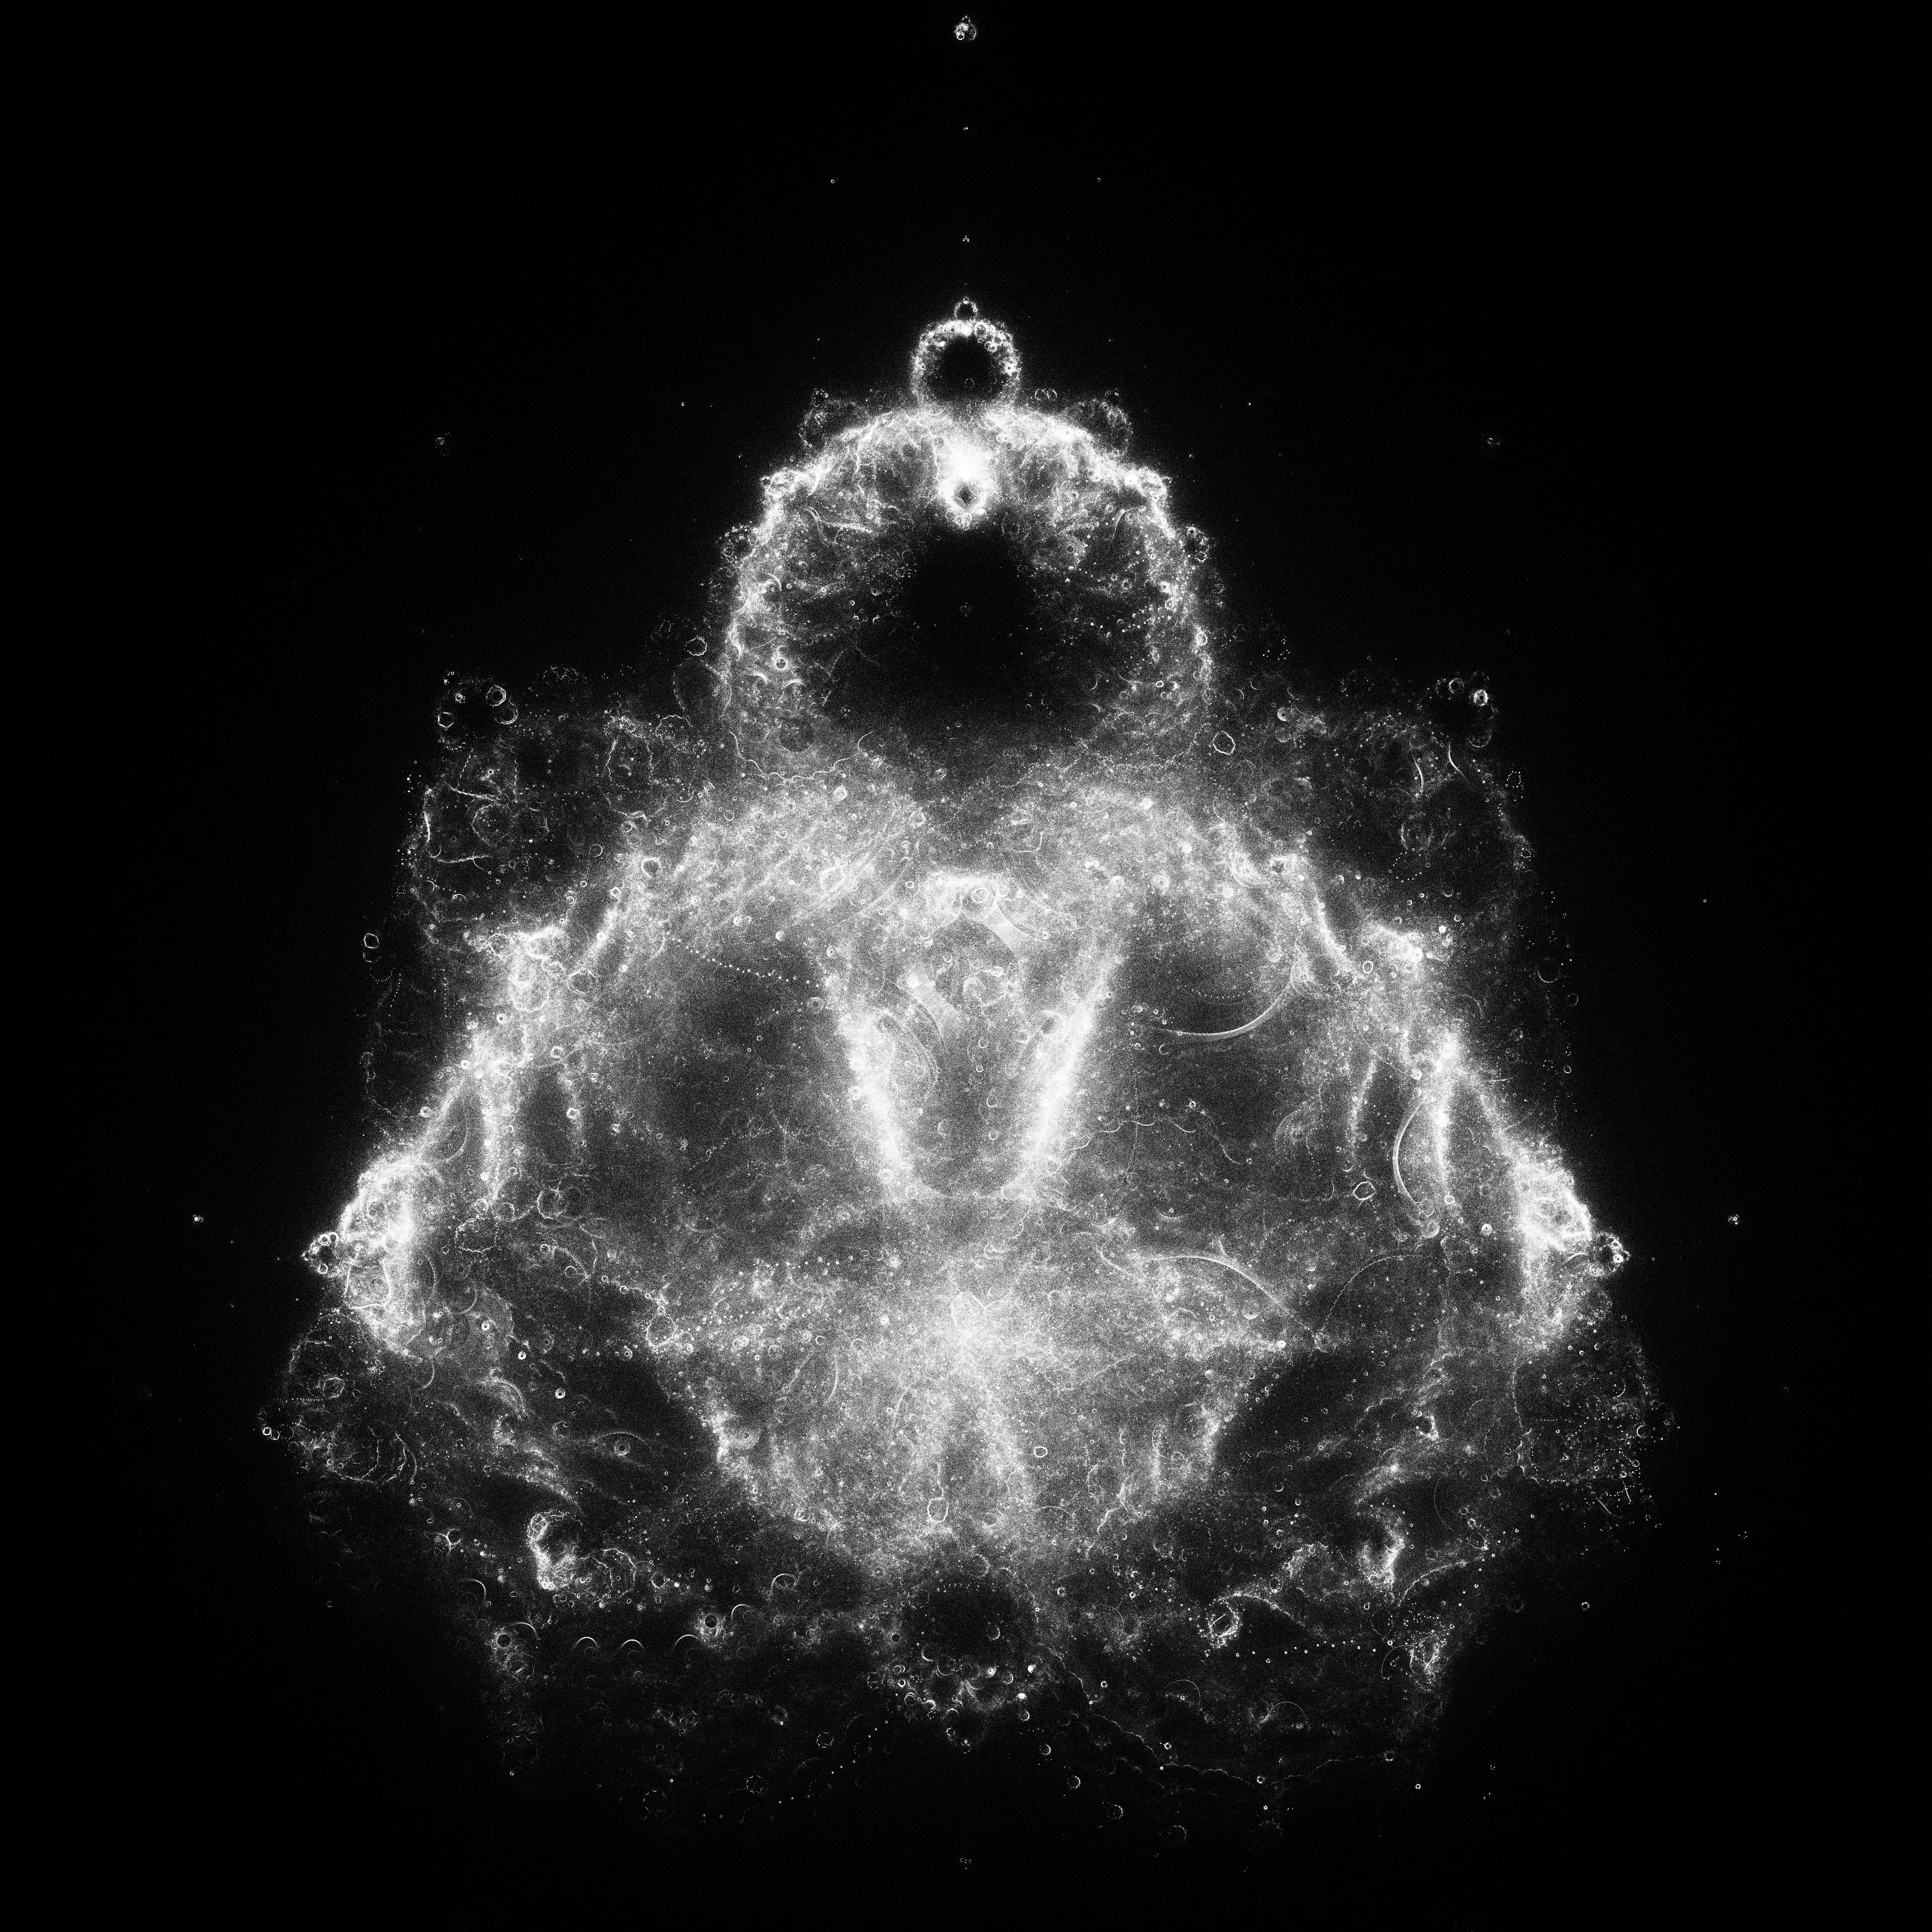
gamma corrected and histogram equalized so it looks cooler
this particular image here, was rendered using a high iteration count (), but a smaller sample count (). sounds weird, but 26 million samples is super low for an image with pixels. we’re basically hoping that our random orbits will hit enough of these 16 million pixels to form something coherent.
i found that the resulting histogram can look dull, because theres a few areas that lots of orbits seem to pass through. so the image ends up with localized super intense spots, which dim out the rest of the histogram. which is why, i use a logarithmic scale or equalize the histogram (used contrast limited adaptive histogram equalization for most of my images).
making it better: importance sampling
instead of randomly picking samples and hoping they produce orbits that land in our image bounds, we can be smarter and generate an importance map before hand.
this idea is borrowed from Benedikt Bitterli’s blog post (which is what inspired this blog post). i believe my method of generating the importance map is slightly different. basically, to begin with, randomly sample a bunch of points, and count up the number of times each points orbit ends up inside our image. by doing this we’re finding the importance of each sample, and then we can assign our sample that importance. this histogram is the importance map.
now to generate the buddhabrot using this importance map to sample. we sample points from the importance map with a probability proportional to their importance. by doing this we are sure to pick a lot more samples that end up in our image.
im sure i have some bug in my code that is messing up my importance map, because i haven’t gotten good results for zoomed in pictures. perhaps if you can correct it, feel free to reach out to me, i’d love to know what i did wrong.
unsurprisingly, the importance map is “important” at the edges of the mandelbrot set:
24 million samples, each with 50k iterations? in my lifetime?
yeah not with a cpu, i am not waiting that long. all of these images, and the buddhabrots in my gallery were rendered on my gpu using cuda c++. the longest was maybe 40 minutes to render, around that ballpark.
i am sure my code is not properly optimized (or even right for that matter) but,
here is the kernel for generating the importance map:
__global__ void importance_kernel(uint32_t *histogram, RenderConfig config,
                                  curandState *states)
{
    int thread_id = blockIdx.x * blockDim.x + threadIdx.x;
    curandState state = states[thread_id];

    float sample_x_min = -2.1667f;
    float sample_x_max = +1.1667f;
    float sample_y_min = -1.667f;
    float sample_y_max = +1.667f;
    float sample_x_range = sample_x_max - sample_x_min;
    float sample_y_range = sample_y_max - sample_y_min;

    for (size_t sample = 0; sample < config.samples_per_thread; ++sample)
    {
        float cr = curand_uniform(&state) * sample_x_range + sample_x_min;
        float ci = curand_uniform(&state) * sample_y_range + sample_y_min;
        float zr = 0.0f, zi = 0.0f;
        float temp_zr = 0.0f;

        size_t iteration = 0, iterations_to_escape = 0;
        bool escaped = false;

        for (iteration = 0; iteration < config.max_iterations; ++iteration)
        {
            temp_zr = zr;
            zr = zr * zr - zi * zi + cr;
            zi = 2.0f * temp_zr * zi + ci;
            iterations_to_escape++;
            if (zr * zr + zi * zi > 4.0f)
            {
                escaped = true;
                break;
            }
        }

        if (!escaped)
            continue;

        int pixel_x = static_cast<int>(((cr - sample_x_min) / sample_x_range) * config.width);
        int pixel_y = static_cast<int>(((ci - sample_y_min) / sample_y_range) * config.height);
        zr = 0.0f, zi = 0.0f;
        for (iteration = 0; iteration < iterations_to_escape - 1; ++iteration)
        {
            temp_zr = zr;
            zr = zr * zr - zi * zi + cr;
            zi = 2.0f * temp_zr * zi + ci;

            // if inside image, increment importance
            if (zr <= config.x_max && zr >= config.x_min && zi <= config.y_max && zi >= config.y_min)
            {
                atomicAdd(&histogram[pixel_x + pixel_y * config.height], 1);
            }
        }

        states[thread_id] = state;
    }
}
and the kernel for sampling and rendering using a cdf to sample (cdf of the imporance map ofc):
__global__ void buddhabrot_kernel(uint32_t *histogram, float *imp_cdf_map,
                                  RenderConfig config, curandState *states)
{
    int thread_id = blockIdx.x * blockDim.x + threadIdx.x;
    curandState state = states[thread_id];
    float x_range = config.x_max - config.x_min;
    float y_range = config.y_max - config.y_min;

    for (size_t sample = 0; sample < config.samples_per_thread; ++sample)
    {
        // sample using inverse CDF
        float u = curand_uniform(&state);

        // binary search to find the pixel corresponding to u in the CDF
        int left = 0;
        int right = config.width * config.height - 1;
        int pixel_idx = 0;

        while (left <= right)
        {
            int mid = left + (right - left) / 2;
            if (imp_cdf_map[mid] < u)
            {
                pixel_idx = mid;
                left = mid + 1;
            }
            else
            {
                right = mid - 1;
            }
        }

        // convert pixel index to coordinates
        int start_pixel_y = pixel_idx / config.width;
        int start_pixel_x = pixel_idx % config.width;

        // convert pixel coordinates to complex plane coordinates with jittering
        float jitter_x = curand_uniform(&state);
        float jitter_y = curand_uniform(&state);
        float cr = -2.1667 + ((start_pixel_x + jitter_x) * 3.33) / (float)config.width;
        float ci = -1.667 + ((start_pixel_y + jitter_y) * 3.33) / (float)config.height;

        float zr = 0.0f, zi = 0.0f;
        float temp_zr = 0.0f;
        size_t iteration = 0, iterations_to_escape = 0;
        bool escaped = false;

        for (iteration = 0; iteration < config.max_iterations; ++iteration)
        {
            temp_zr = zr;
            zr = zr * zr - zi * zi + cr;
            zi = 2.0f * temp_zr * zi + ci;
            iterations_to_escape++;
            if (zr * zr + zi * zi > 4.0f)
            {
                escaped = true;
                break;
            }
        }

        if (!escaped)
            continue;

        zr = 0.0f, zi = 0.0f;
        for (iteration = 0; iteration < iterations_to_escape; ++iteration)
        {
            temp_zr = zr;
            zr = zr * zr - zi * zi + cr;
            zi = 2.0f * temp_zr * zi + ci;

            int pixel_x = static_cast<int>(((zr - config.x_min) / x_range) * config.width);
            int pixel_y = static_cast<int>(((zi - config.y_min) / y_range) * config.height);

            if (pixel_x >= 0 && pixel_x < static_cast<int>(config.width) &&
                pixel_y >= 0 && pixel_y < static_cast<int>(config.height))
            {
                atomicAdd(&histogram[pixel_y * config.width + pixel_x], 1);
            }
        }
    }
    states[thread_id] = state;
}
you can make this pretty cool if you generate 3 histograms based on different iteration sized, and combine them into an rgb image.
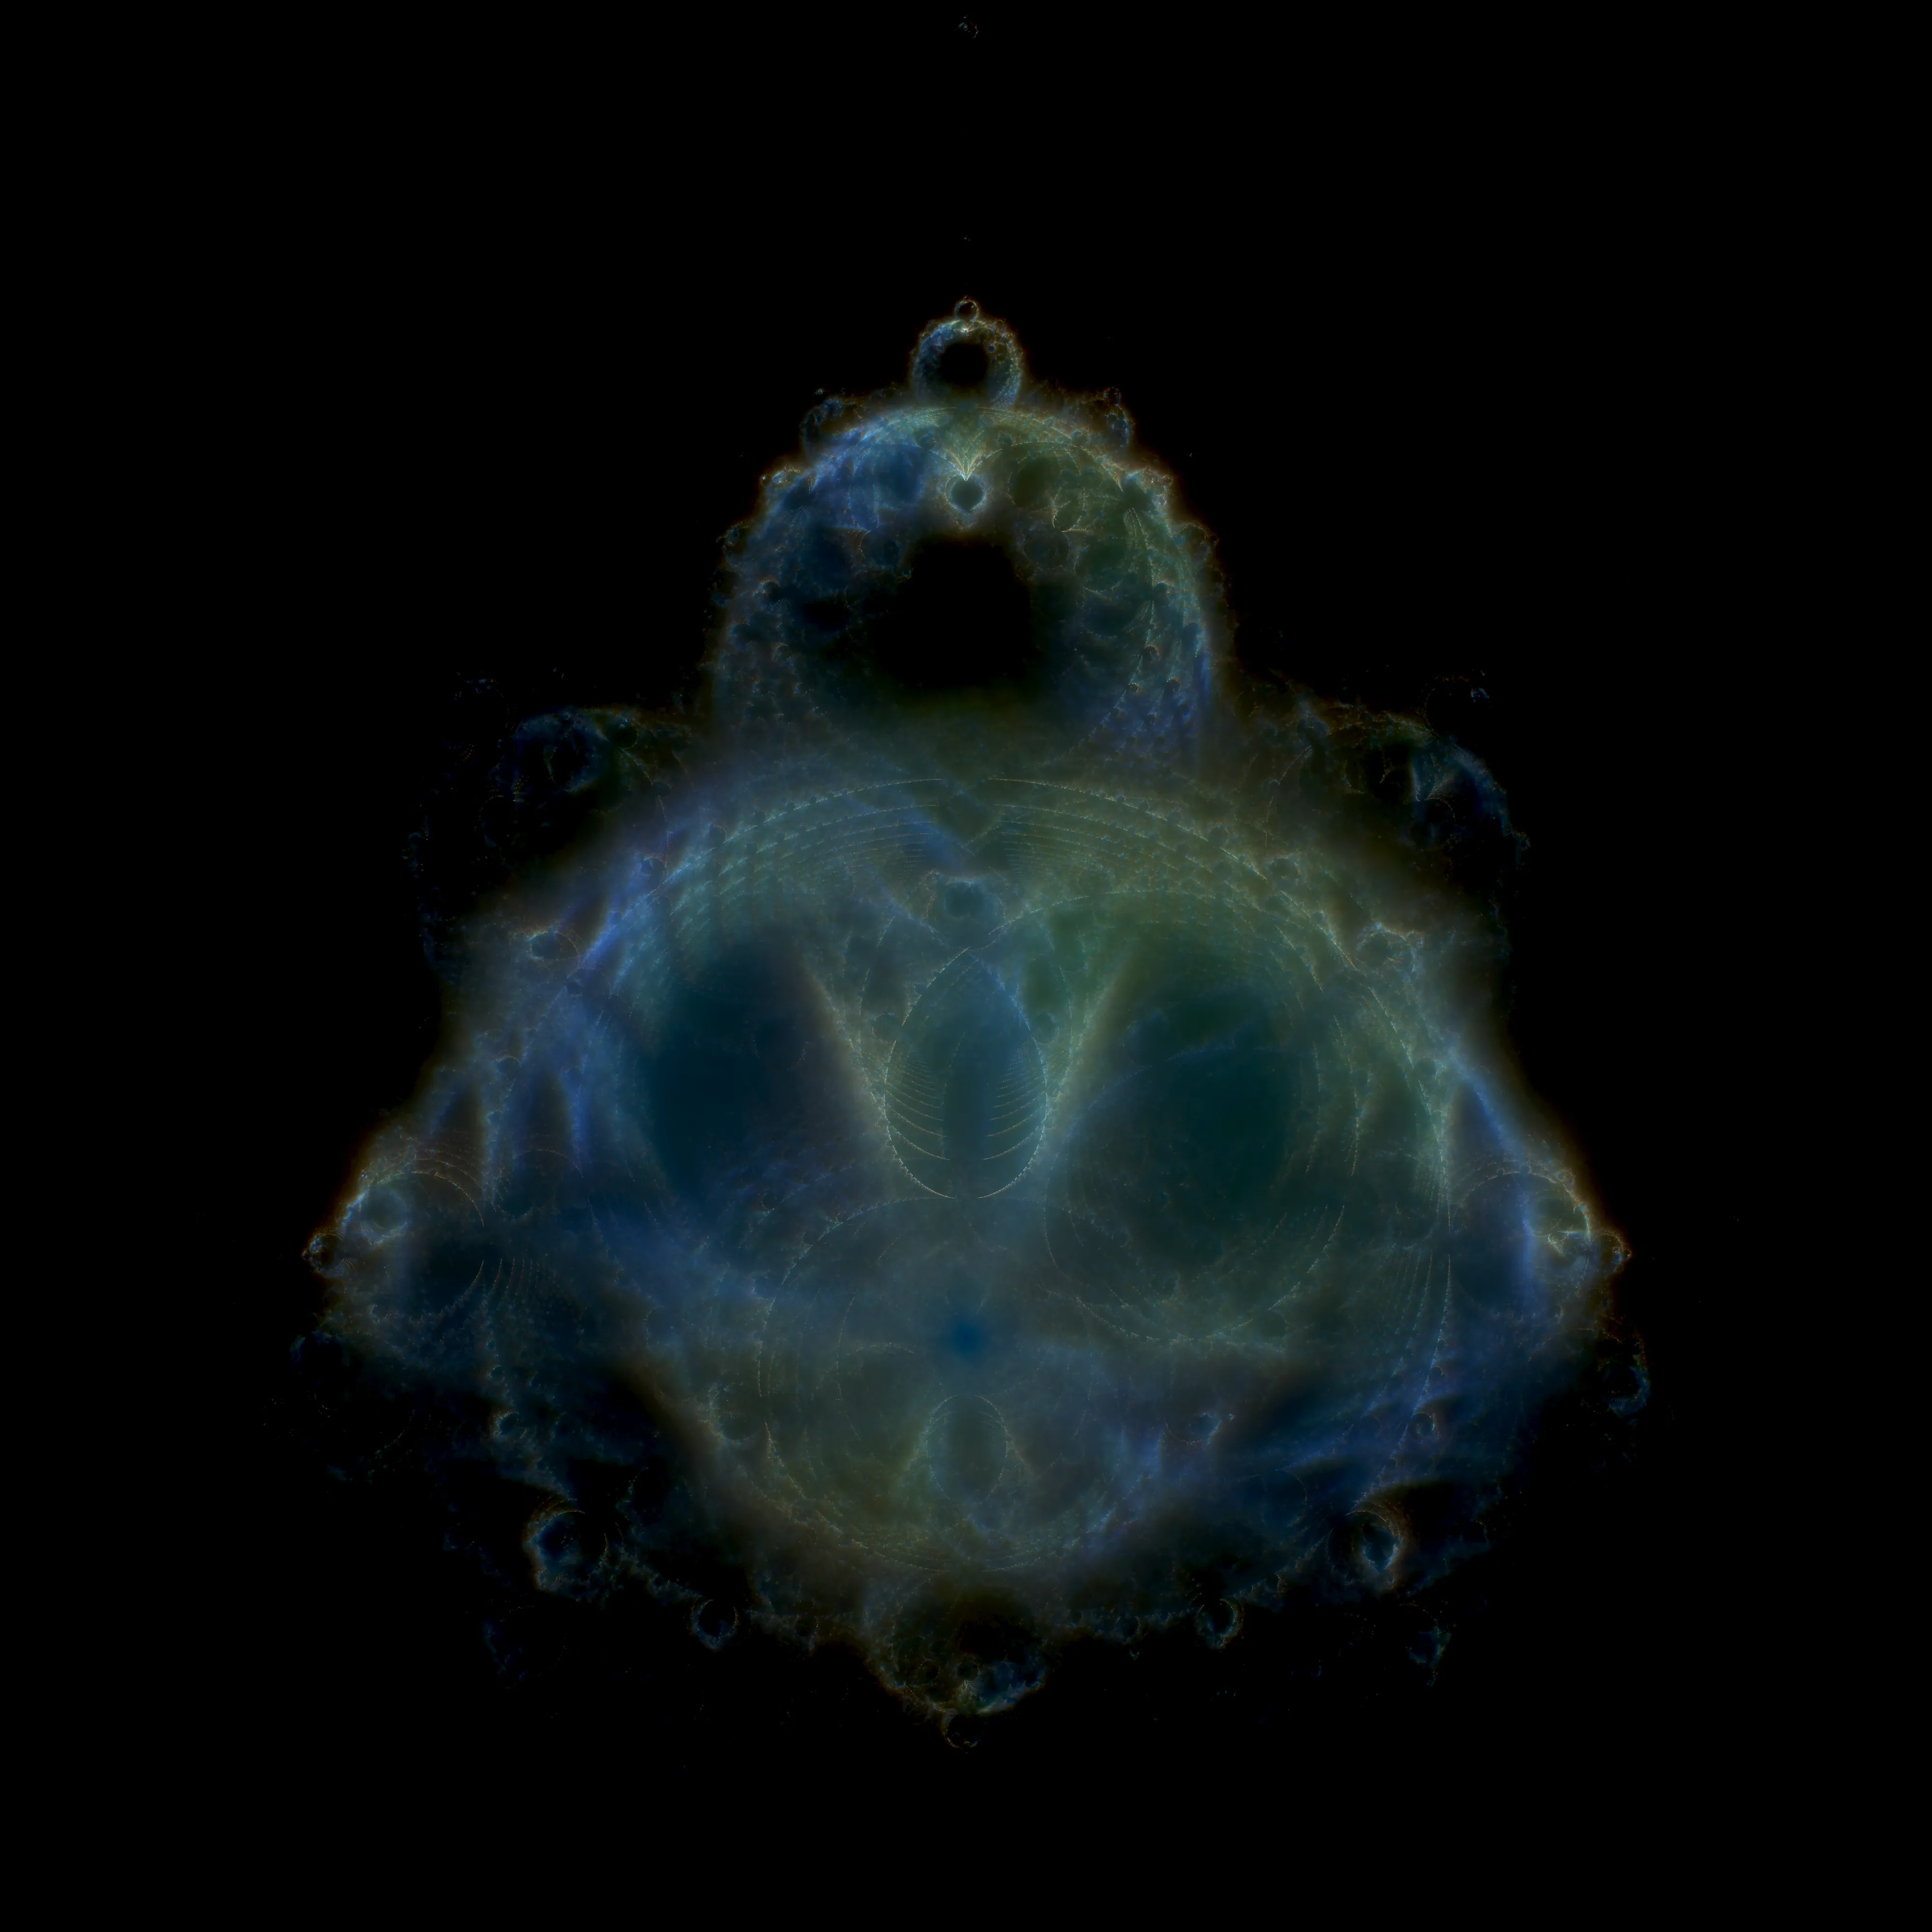
this has a css brightness filter on fyi
all of these images were generated using a simple cli tool i made to play around with. checkout the gallery for more.
if you’re curious, you can find it here. pls don’t come after me for my shart code, im still new to cpp (i think i always will be).